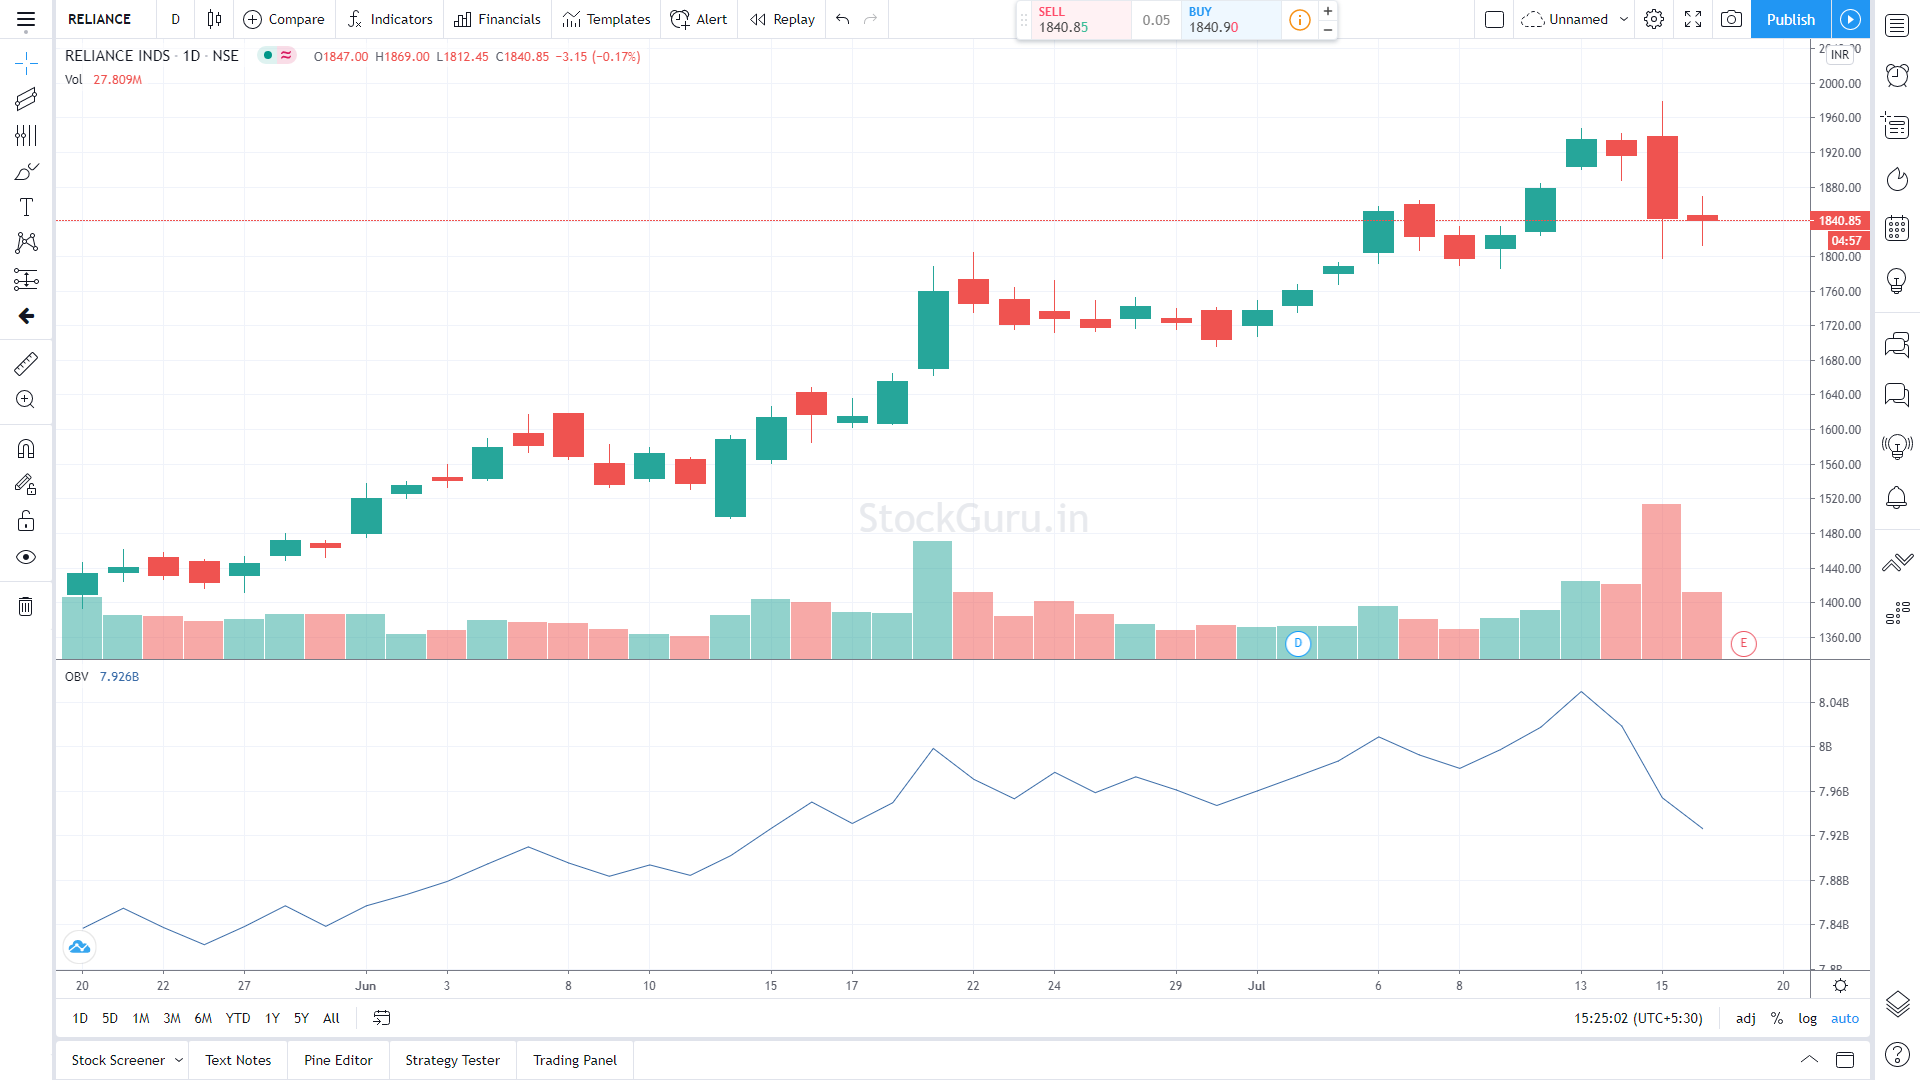
OBV - On Balance Volume
OBV was created by Joe Granville, the father of OBV analysis. This is a running total of volume that relates price changes and volume and shows accumulation and distribution action.
The classic OBV is calculated by adding today’s total volume to a cumulative total when price closes higher than yesterday’s close and subtracting today’s total volume from the cumulative when the price closes lower than yesterday’s close. If price remains the same, then the OBV is not changed. The actual amount of the price change is irrelevant and only the direction of change is significant for these calculations.
This indicator defines trends by showing underlying strength of price movements over time. A solid price trend is assumed to be accompanied with a stronger volume movement in the same direction. OBV analysis assumes that volume trends lead price trends and that OBV changes generally precede price changes. Look for divergence or non-confirmation between price and volume movements. A stock that is trending in an upward direction and starts to experience higher volume on days of lower closing prices usually indicates an end to the current trend. Look for changes or breakouts in OBV trends. Sell short when the OBV makes a downside breakout and buy long when the on OBV upside breakouts.

